[Week 15] Simulation Evaluation
Posted

Historic
| week | Winner Accuracy |
|---|---|
| 15 | 25% |
| 14 | 60% |
| 13 | 80% |
| 12 | 40% |
| 11 | 60% |
| 10 | 40% |
| 9 | 20% |
| 8 | 60% |
| 7 | 20% |
| 6 | 100% |
| 5 | 80% |
| 4 | 60% |
| 3 | 80% |
| 2 | 60% |
| 1 | 80% |
Matchups Winner Predictions
| game | prediction | win.prob | who.won |
|---|---|---|---|
| Jersey Boys @ Sorocaba Wild Mules | Sorocaba Wild Mules | 56.4% | Jersey Boys |
| Amparo Bikers @ Indaiatuba Blues | Amparo Bikers | 61.5% | Amparo Bikers |
| Campinas Giants @ Sorocaba Steelers | Campinas Giants | 79.4% | Sorocaba Steelers |
| Paulinia Robots @ Indaiatuba Riders | Paulinia Robots | 68.7% | Indaiatuba Riders |
Score Prediction Chart
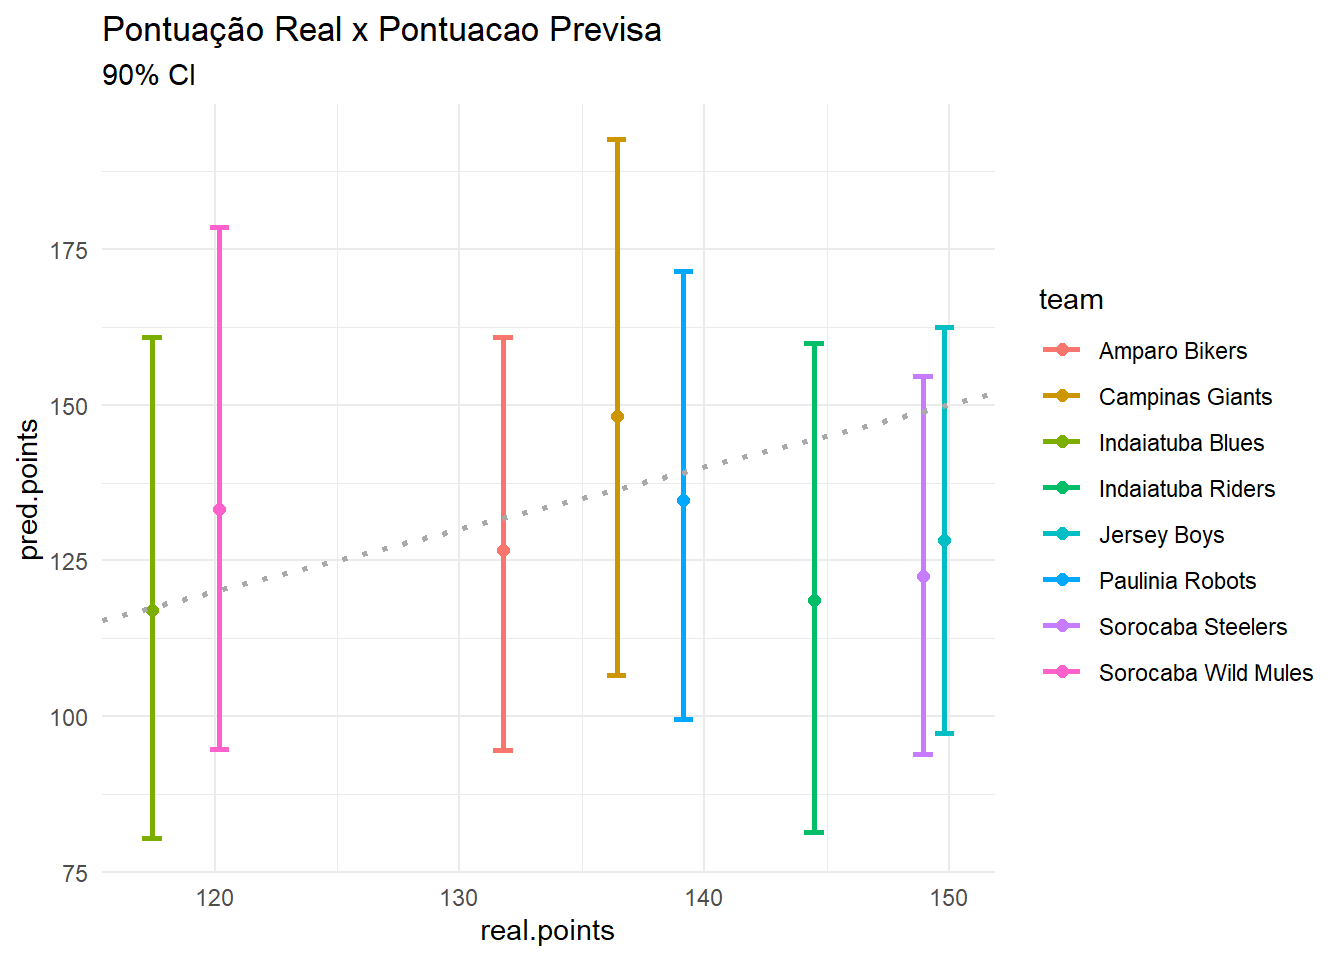
Score Prediction Table
| team | real.points | pred.min | pred.points | pred.max |
|---|---|---|---|---|
| Jersey Boys | 149.80 | 97.28 | 128.25 | 162.43 |
| Sorocaba Steelers | 148.92 | 93.90 | 122.49 | 154.63 |
| Indaiatuba Riders | 144.48 | 81.42 | 118.62 | 159.96 |
| Paulinia Robots | 139.14 | 99.47 | 134.69 | 171.51 |
| Campinas Giants | 136.42 | 106.56 | 148.14 | 192.62 |
| Amparo Bikers | 131.78 | 94.52 | 126.64 | 160.90 |
| Sorocaba Wild Mules | 120.20 | 94.66 | 133.18 | 178.53 |
| Indaiatuba Blues | 117.44 | 80.34 | 117.00 | 160.86 |
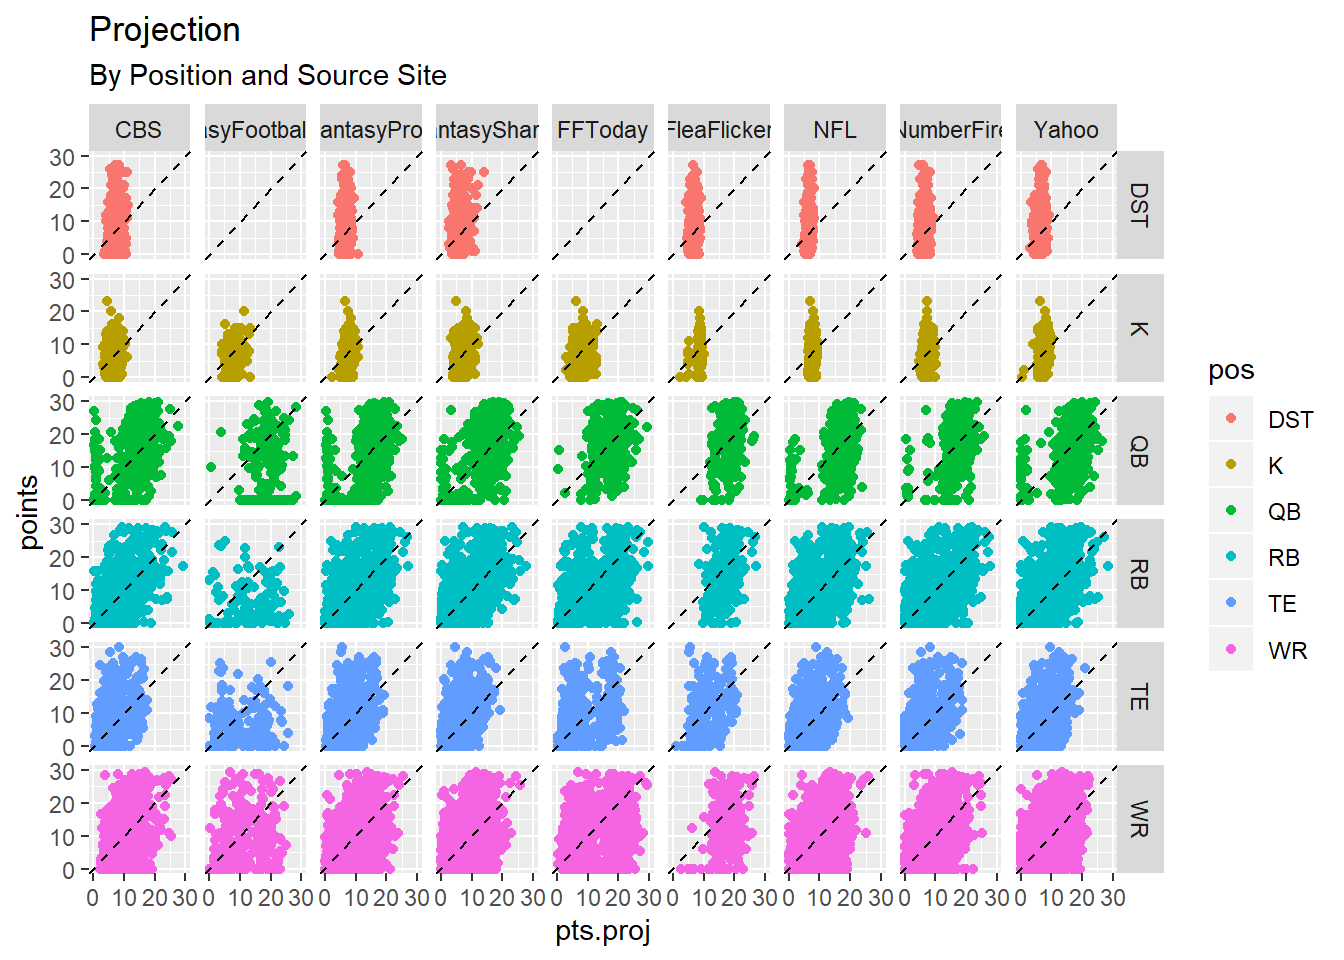
Players Points vs Projection
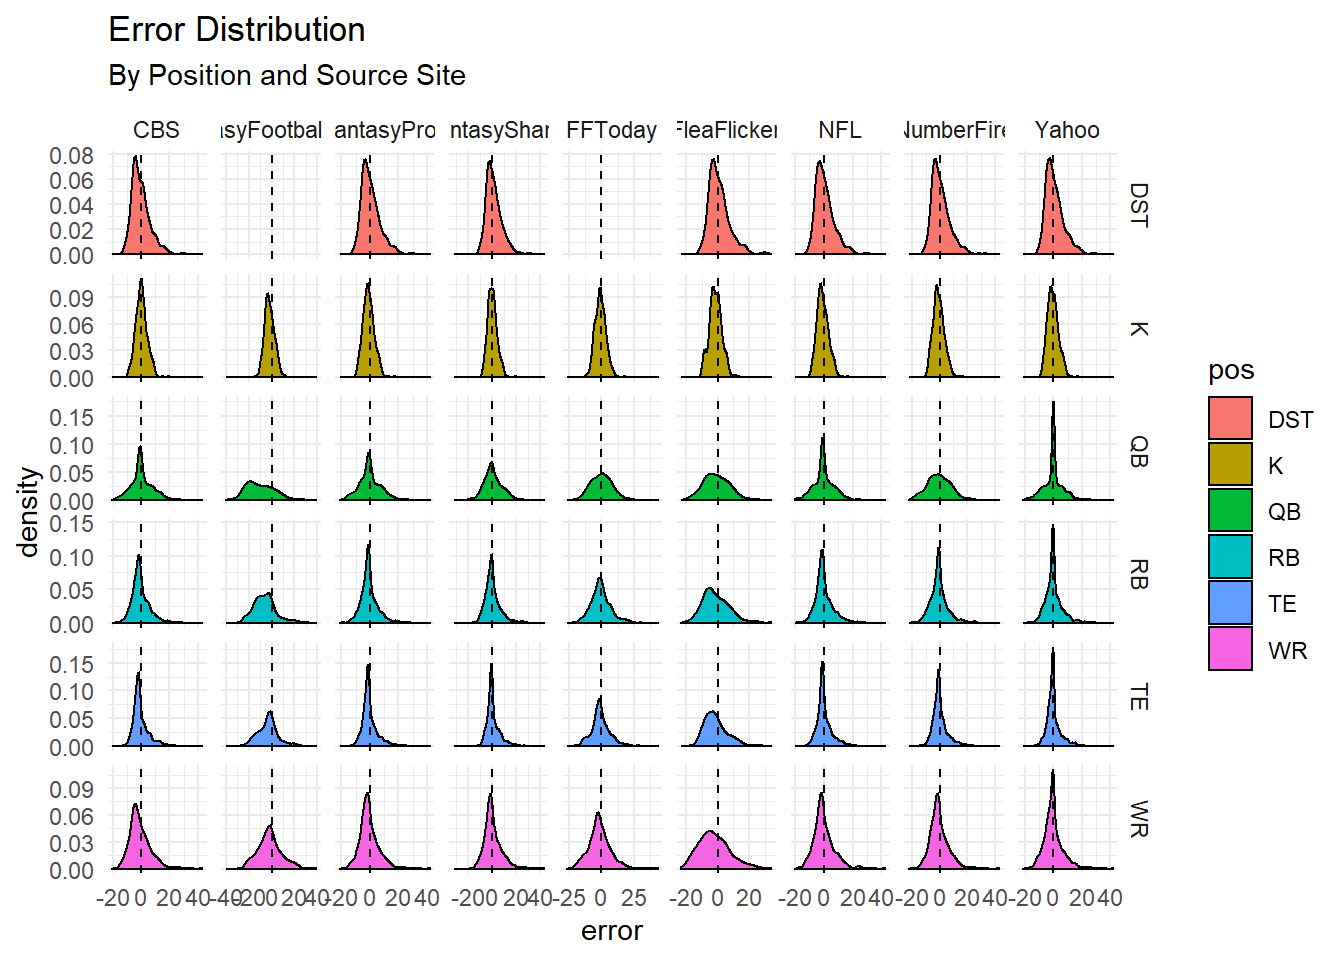
Projection Error Distribution