[Week 16] Simulation Evaluation
Posted

Historic
| week | Winner Accuracy |
|---|---|
| 16 | 25% |
| 15 | 25% |
| 14 | 60% |
| 13 | 80% |
| 12 | 40% |
| 11 | 60% |
| 10 | 40% |
| 9 | 20% |
| 8 | 60% |
| 7 | 20% |
| 6 | 100% |
| 5 | 80% |
| 4 | 60% |
| 3 | 80% |
| 2 | 60% |
| 1 | 80% |
Matchups Winner Predictions
| game | prediction | win.prob | who.won |
|---|---|---|---|
| Jersey Boys @ Amparo Bikers | Jersey Boys | 67.8% | Amparo Bikers |
| Sorocaba Wild Mules @ Indaiatuba Blues | Sorocaba Wild Mules | 60.6% | Indaiatuba Blues |
| Sorocaba Steelers @ Indaiatuba Riders | Sorocaba Steelers | 80.3% | Indaiatuba Riders |
| Campinas Giants @ Paulinia Robots | Campinas Giants | 55.7% | Campinas Giants |
Score Prediction Chart
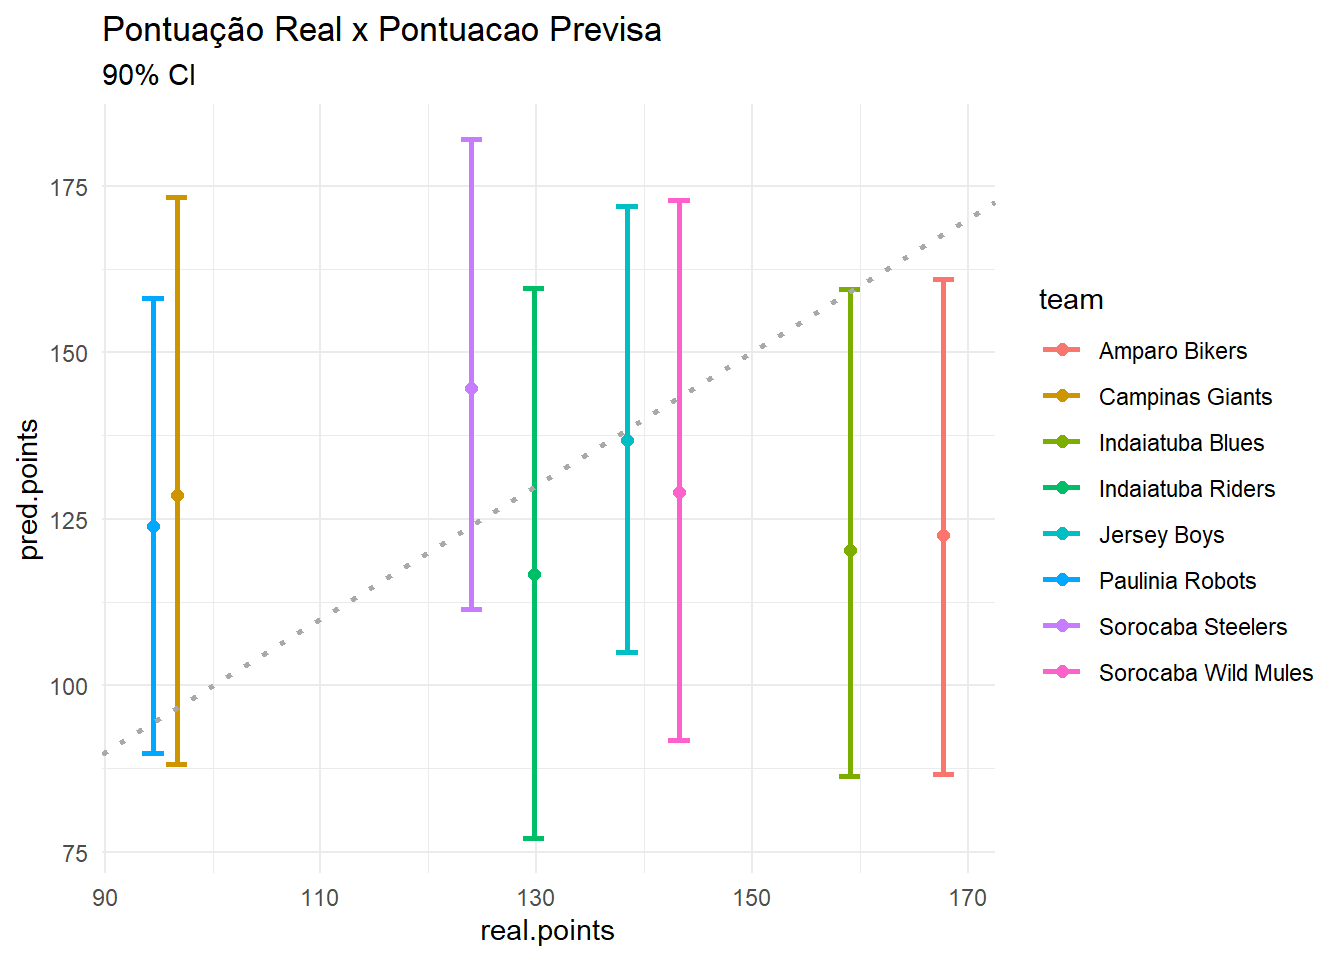
Score Prediction Table
| team | real.points | pred.min | pred.points | pred.max |
|---|---|---|---|---|
| Amparo Bikers | 167.76 | 86.61 | 122.60 | 160.91 |
| Indaiatuba Blues | 159.06 | 86.33 | 120.22 | 159.54 |
| Sorocaba Wild Mules | 143.24 | 91.82 | 129.03 | 172.83 |
| Jersey Boys | 138.42 | 104.98 | 136.86 | 172.00 |
| Indaiatuba Riders | 129.76 | 76.97 | 116.74 | 159.58 |
| Sorocaba Steelers | 124.00 | 111.37 | 144.61 | 181.95 |
| Campinas Giants | 96.66 | 88.22 | 128.56 | 173.32 |
| Paulinia Robots | 94.46 | 89.78 | 123.93 | 158.13 |
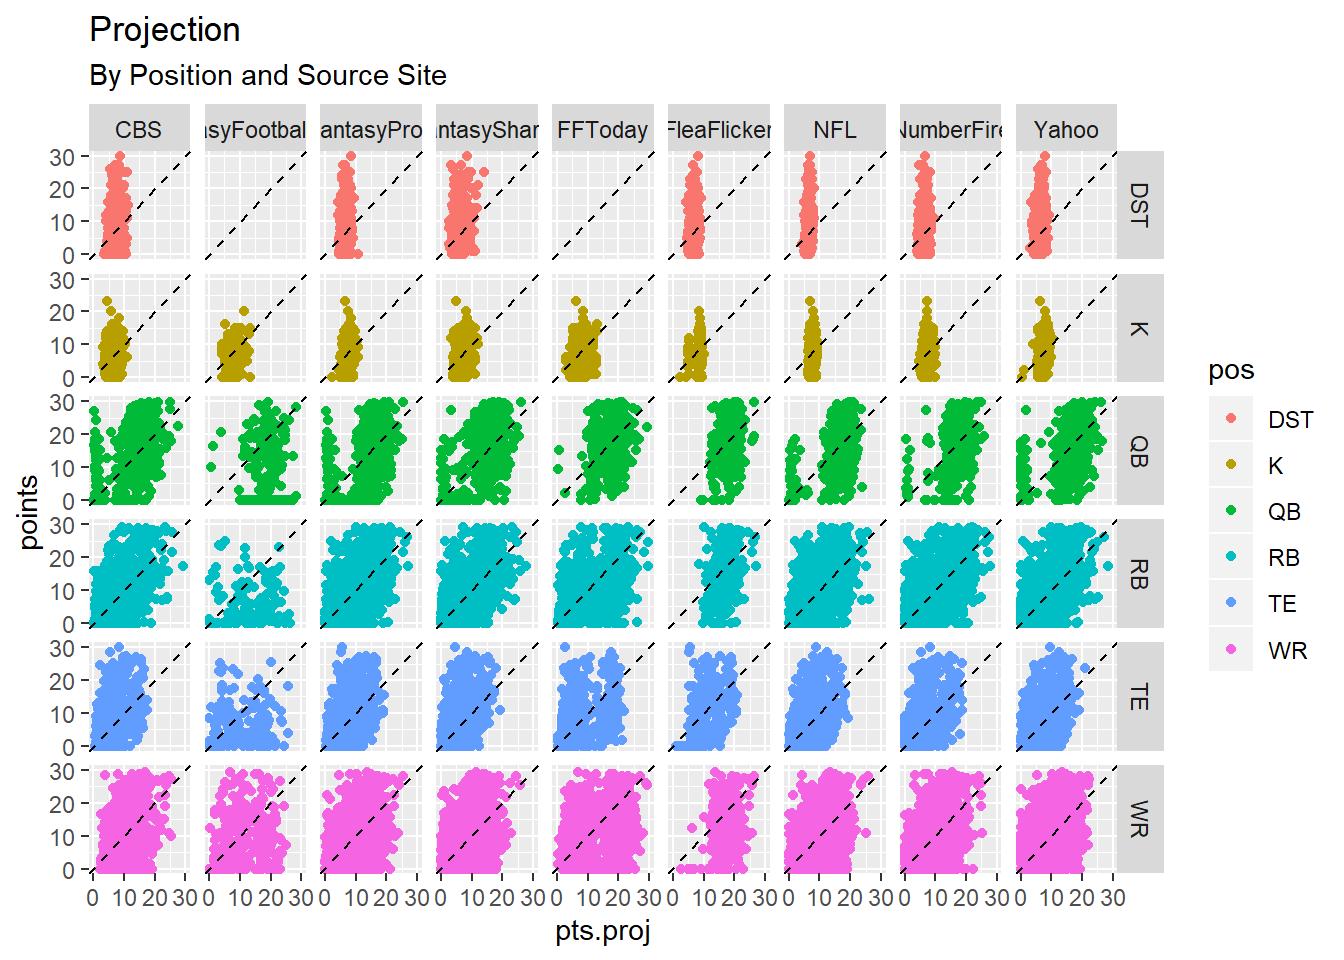
Players Points vs Projection
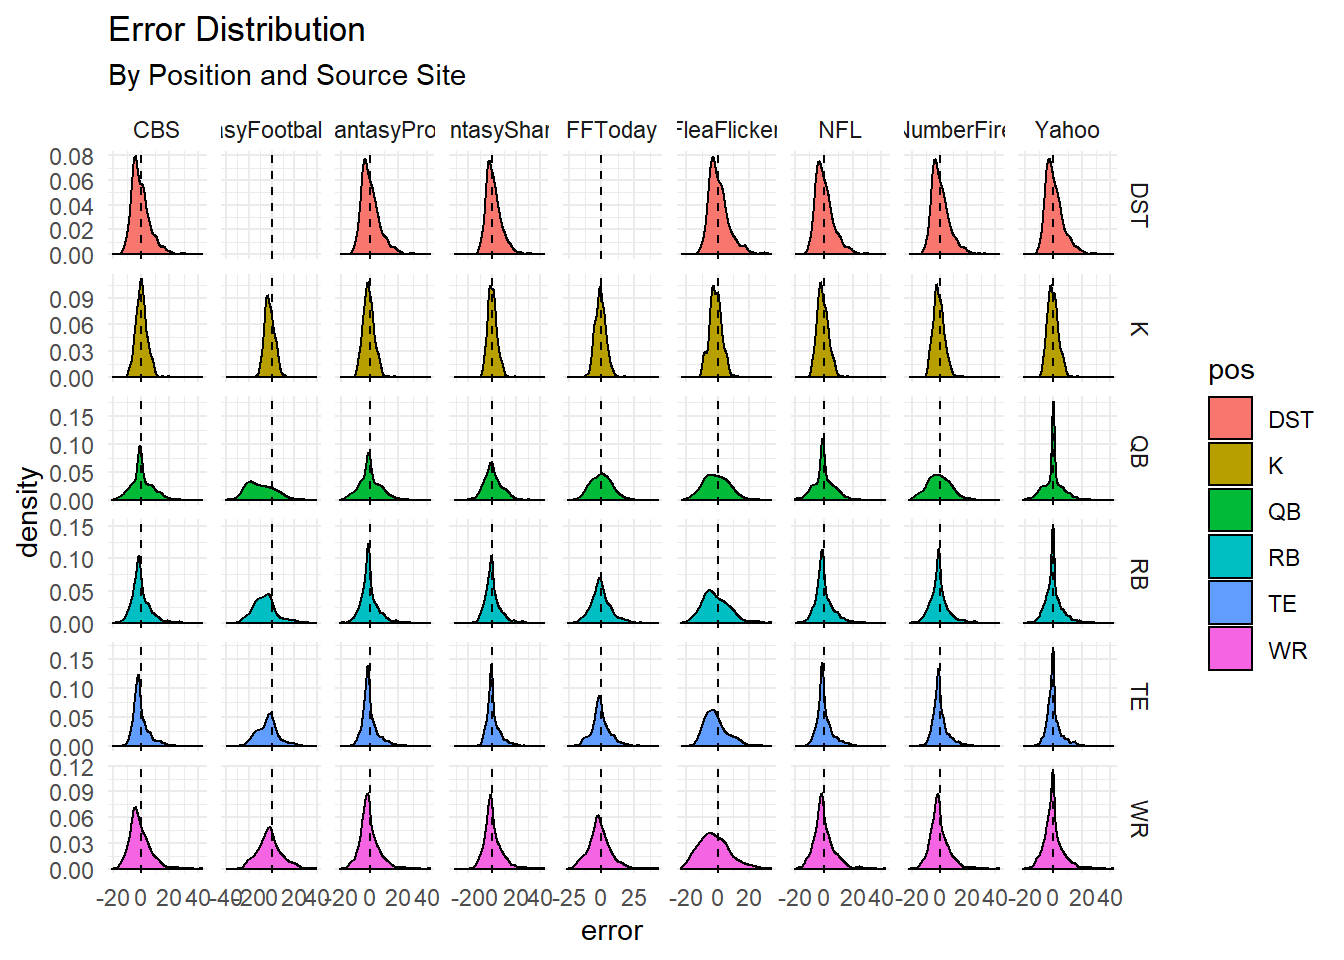
Projection Error Distribution